
How to Set Up Claude Desktop for File Analysis
Before Claude can work with your files, you need to give it a place to read and write. Here is how to create a dedicated folder and connect it to Claude Desktop.
Create Your Working Folder
Create a folder called Claude somewhere easy to find. On a Mac, open Finder and create it inside Documents. On Windows, do the same in your Documents folder or wherever makes sense. This is the one folder Claude will have access to -- think of it as a shared workspace between you and the AI.
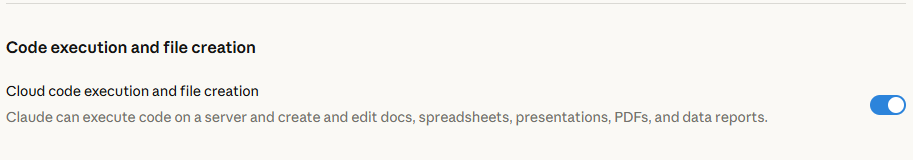
Enable Code Execution
Open Claude Desktop and head to Settings (click "Claude" in the Mac menu bar, or the settings icon on Windows). In the left sidebar, find the Capabilities tab and make sure the "Code execution and file creation" toggle is turned on. If you had to flip it, restart the app before moving on.
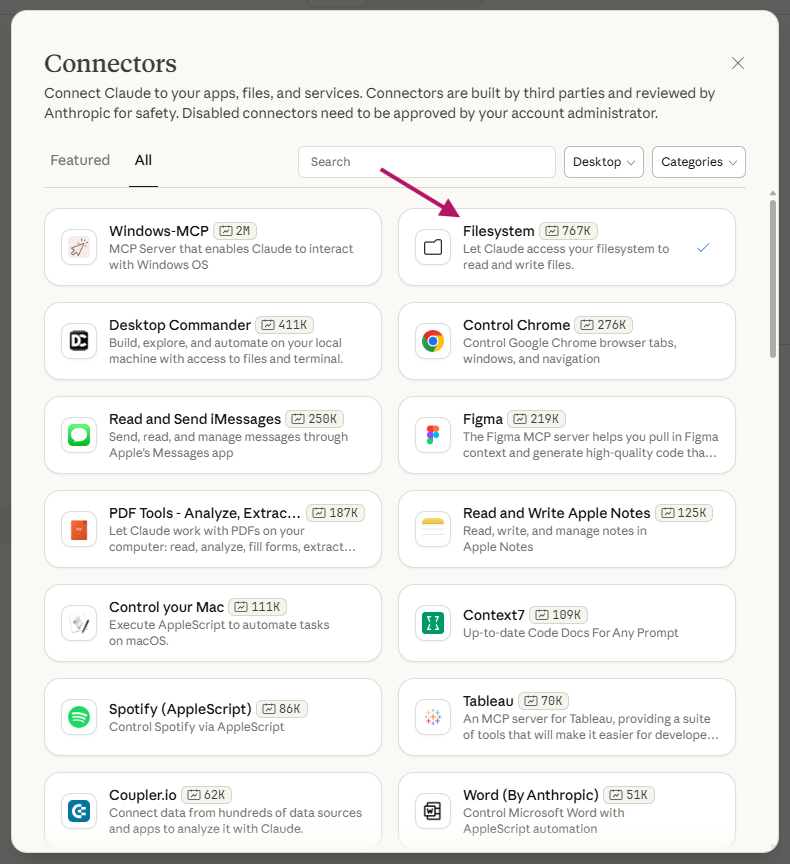
Install the Filesystem Extension
Still in Settings, scroll down to the Desktop app section in the left sidebar, then click Extensions, then Browse Extensions. Find and install the Filesystem Extension. This is what allows Claude to read and write files on your machine.
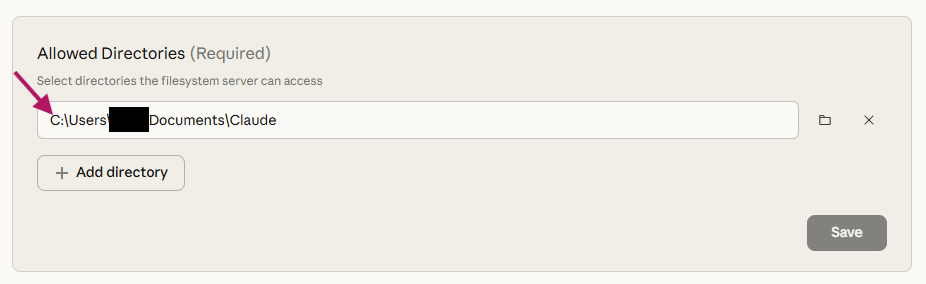
Point Claude to Your Folder
Once the extension is installed, tell it which directory Claude can access. Add the "Claude" folder you just created. You will also see a permissions option: choose "Always Allow" for a frictionless experience, or leave it on "Needs Approval" if you prefer to see exactly what Claude does before it touches any files. Hit Save, then restart Claude Desktop one more time.
That is it for setup. You now have a local AI assistant that can read your files, run code, and produce output -- all on your machine.
Analyze Your Data with Claude Desktop -- Step by Step
Now for the fun part.
We will take a real dataset -- in this example, a JSON export of hosted form data from a website -- and turn it into a clean, grouped summary in Excel. No scripting. No pandas. Just conversation. This is what no-code data analysis actually looks like.
Step 1: Drop Your File in the Folder
Download your data file and move it into the Claude folder you set up earlier.
Step 2: Tell Claude to Load the File
Start a new conversation in Claude Desktop and type something like:
Start by first copying the file to Claude: 'www-sample-com_forms.json'
Claude will ask for file access permission the first time. Grant it, then let it work. You will see it confirm that the file has been copied over and is ready to go.
Step 3: Explore the Data
Ask questions in plain English. A good opening move:
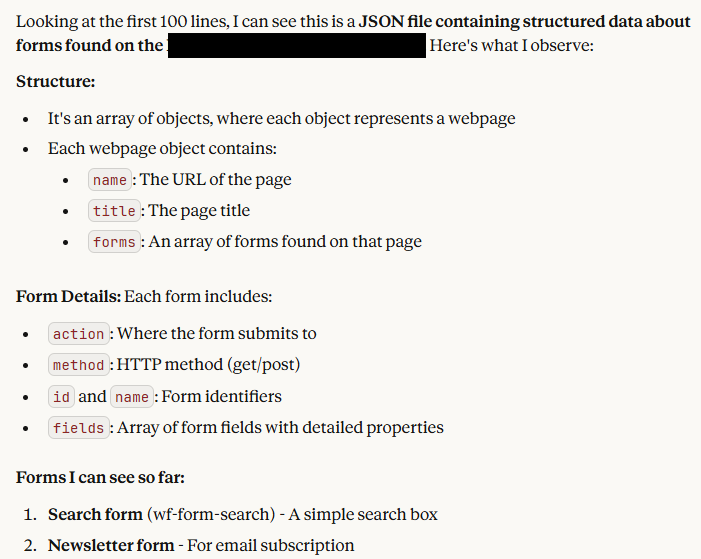
Look at the first few hundred lines of that file.
Claude will read the file, recognize the structure, and give you a summary of what is inside: field names, data types, how many records there are. This is your orientation step -- you are getting a feel for the shape of the data without opening a single tool.
Step 4: Ask Your Real Question
Once you know what you are working with, go after what you actually want to know:
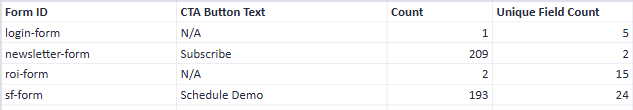
Look at the forms in there, group them by name, and give me the names and counts of each form.
Claude will write and execute the code behind the scenes, then come back with a clean summary: a table of form names and how many submissions each one received. No SQL. No spreadsheet formulas. Just a question and an answer.
Step 5: Export Your Analysis to Excel
Happy with what you see? Ask Claude to make it permanent:
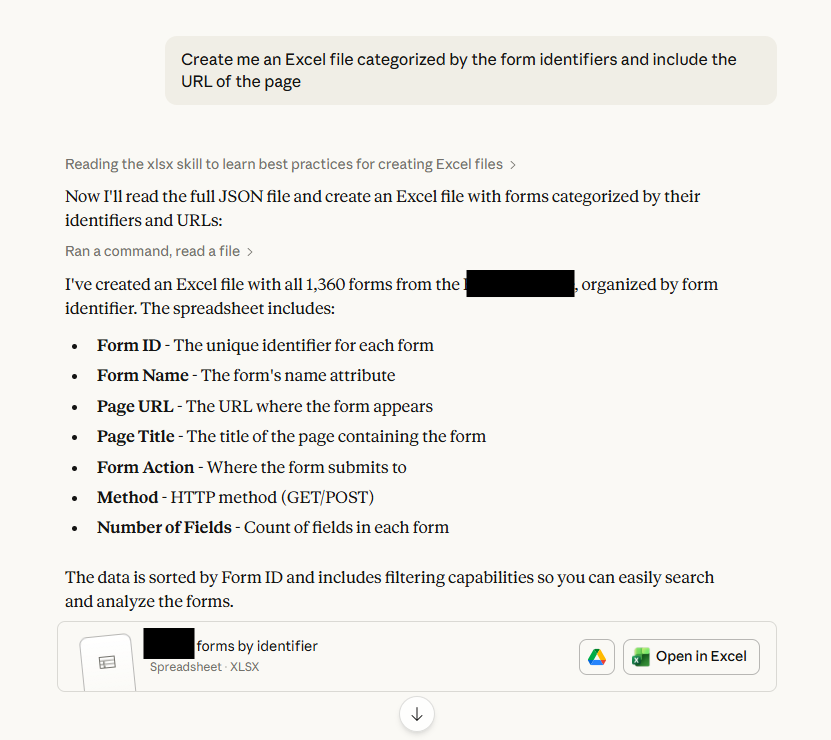
Make this a table in Excel.
Claude will generate a formatted .xlsx file and save it to your working folder. Open it up and you have a polished spreadsheet ready to share, drop into a presentation, or build on further.
Go Further with Claude Desktop Analysis
The workflow above took maybe five minutes from start to finish. The real power is in what comes next. Once Claude has your data loaded, you can keep going:
- Ask it to filter the data: "Show me only submissions from the last 30 days."
- Ask it to visualize: "Create a bar chart of the top 10 forms by submission count."
- Ask it to cross-reference: "Break this down by month and form name."
- Ask it to build something new: "Create a dashboard summary with key metrics."
For marketers, this means you can pull your own campaign insights without waiting on a data team or wrestling with a BI tool. Analyze form conversions, compare content performance across channels, or audit UTM data -- all by asking.
The only limits are your imagination and what Claude can express in Excel and TypeScript.
Claude Desktop vs. BI Tools for Quick Analysis
Most quick analysis tasks do not need a full BI tool or a data engineering pipeline. They need someone -- or something -- that can open a file, understand what is inside, and answer a few questions.
Where traditional BI tools require setup, configuration, and often a dedicated analyst, Claude Desktop gives you an on-demand data analyst that speaks plain English. It runs locally, works with your actual files, and does not require a license, training, or a dashboard nobody maintains.
That is not to say it replaces Tableau or Looker for enterprise reporting. But for the 80% of quick analysis tasks that marketers deal with -- "how did that form perform last month?" or "which UTMs are actually driving conversions?" -- Claude Desktop fills the gap perfectly.
Set it up once, and you have an analyst on call whenever you need one.